What Agency Owners Actually Get from LiGo Analytics: Real Numbers, Real Decisions
LiGo Analytics gives agency owners real LinkedIn data that matters: optimal posting times, content performance, and audience insights. Stop guessing, start knowing.
Junaid Khalid
3/13/20255 min read
If you own an agency, LinkedIn isn't just another social media platform—it's a client acquisition channel and a reputation builder. But most agency owners I talk to face the same issue: they know LinkedIn is important, but they're flying blind.
They post. They comment. They connect. And then... what? How do you know what's actually working? How do you know if all that time is turning into anything meaningful?
I built LiGo Analytics to answer exactly these questions.
Let me walk you through what LiGo's analytics actually show you (not vague promises about "insights" or "optimization"—the actual numbers and decisions they enable).
What You'll Actually See in LiGo Analytics
When you open LiGo Analytics, you immediately get a dashboard that shows your real LinkedIn performance:
1. Audience Numbers: Your Starting Point
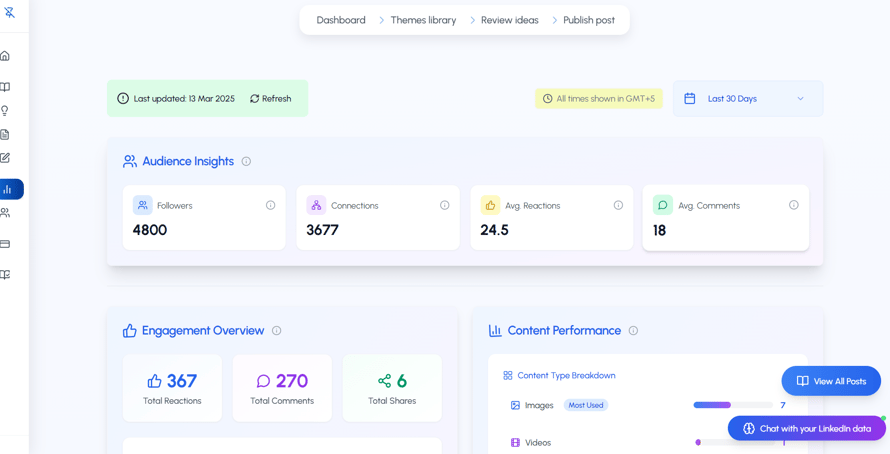
Right at the top, you see:
Your total followers
Your connections
Average reactions per post
Average comments
This establishes your baseline—because you can't improve what you don't measure. The averages per post are particularly useful since they're not readily visible on LinkedIn itself.
2. Engagement Overview: The Complete Picture
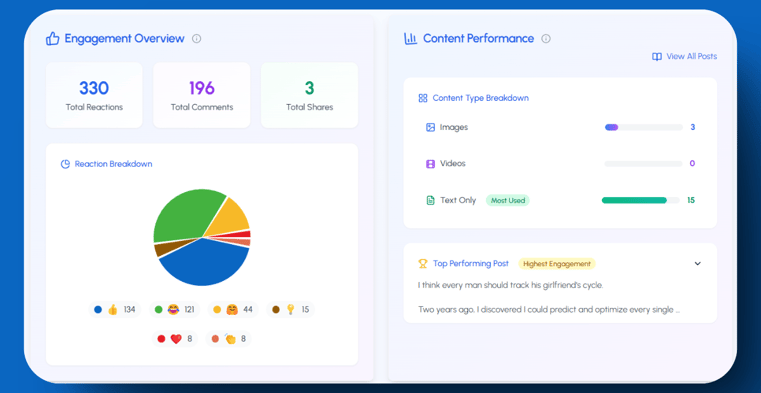
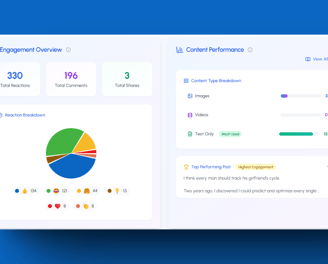
The next section breaks down:
Total reactions, comments, and shares for your selected timeframe
A breakdown of reaction types (important because "insightful" reactions often come from different audience segments than "like" reactions)
Which content types you're posting most often (text, images, video)
Your highest performing post during this period
This matters because most agency owners have a skewed perception of what's working. I've had countless conversations where someone swears video is their best performer, but the data shows text posts actually drive twice the engagement.
3. Engagement Over Time: Progress Tracking
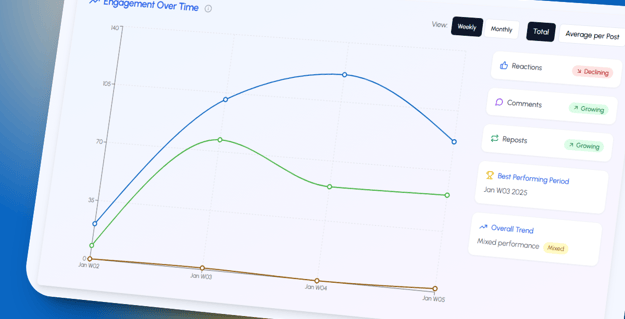
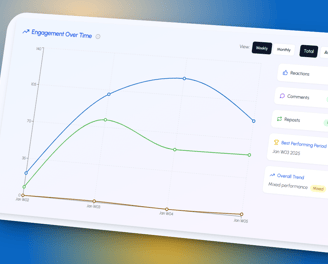
This graph shows you three trend lines:
Reactions over time
Comments over time
Shares over time
You can toggle between weekly and monthly views, and also see averages per post.
What makes this powerful for agency owners? It answers the fundamental question: "Is my LinkedIn strategy improving or declining?" You'll see immediately if you're on an upward trajectory or if something changed that's causing engagement to drop.
One agency owner discovered his engagement had been steadily declining for three months—precisely since his team took over his posting schedule. This single insight led to a complete strategy reset that doubled his engagement in two weeks.
The Hidden Patterns LiGo Reveals
Most LinkedIn analytics stop at basic numbers. LiGo goes deeper to show you patterns you'd never spot manually:
4. Optimal Timing: When Your Audience Engages
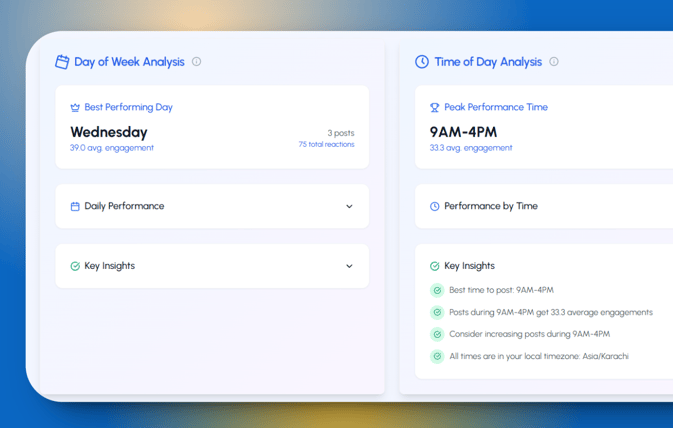
The timing analysis shows:
Your best-performing day of the week
A day-by-day engagement breakdown
Your optimal posting time (in 2-hour blocks across the day)
Key insights about your specific audience patterns
A software development agency owner discovered his audience engaged 3x more on Tuesdays than any other day, and specifically between 7-9am. This single insight allowed him to focus his limited LinkedIn time for maximum impact.
5. Consistency Patterns: Your Posting Habits
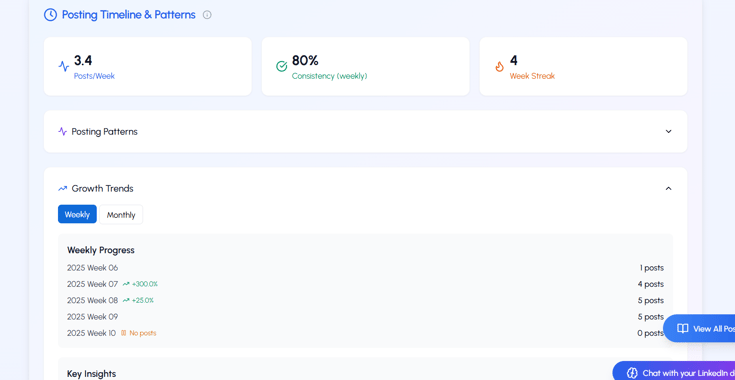
This section doesn't hold back:
Your consistency percentage (how regularly you actually post)
Your current week streak
Average posts per week
A heat map showing your posting frequency
Why does this matter? Because most agency owners think they're more consistent than they really are. One agency founder was shocked to discover he'd only posted 17 times in the past 90 days, despite feeling like he was "always on LinkedIn."
6. Content Strategy Insights: What Works For Your Audience
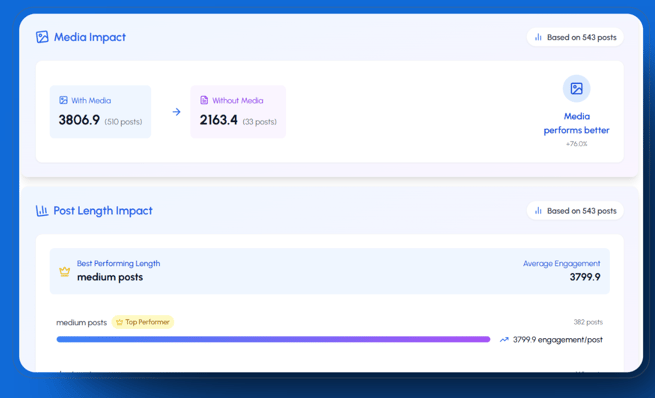
This is where it gets good. LiGo shows you:
Whether posts with media outperform text-only posts (and by how much)
Whether short, medium, or long posts drive more engagement for your specific audience
A design agency owner discovered her audience engaged 42% more with text-only posts than with images—the exact opposite of what she expected. This led her to completely shift her content mix, saving hours of graphic design time while actually improving results.
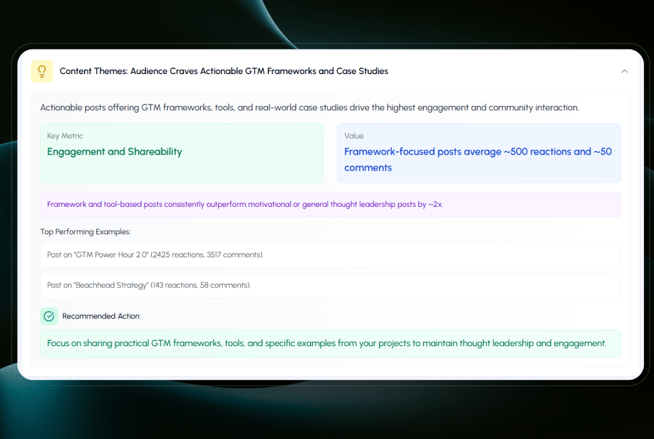
AI Insights: Actionable Recommendations
At the bottom of your analytics, you'll find the "Generate AI Insights" button. This gives you 5 specific recommendations based on your data:
Optimal posting times based on your historical performance
Content type recommendations specific to your audience
Theme/topic performance analysis
Engagement pattern insights
Network growth opportunities
For example, one agency owner received this insight:
"Posts made early in the morning (7-9 AM GMT) consistently outperform others, with +25% higher engagement compared to other times. Your post on 'GTM Power Hour' posted early morning received 2425 reactions and 3517 comments, while your 'Beachhead Strategy' post (late afternoon) received only 143 reactions and 58 comments."
This isn't generic advice—it's specific to your actual LinkedIn performance.
Chat With Your LinkedIn Data: Ask Anything
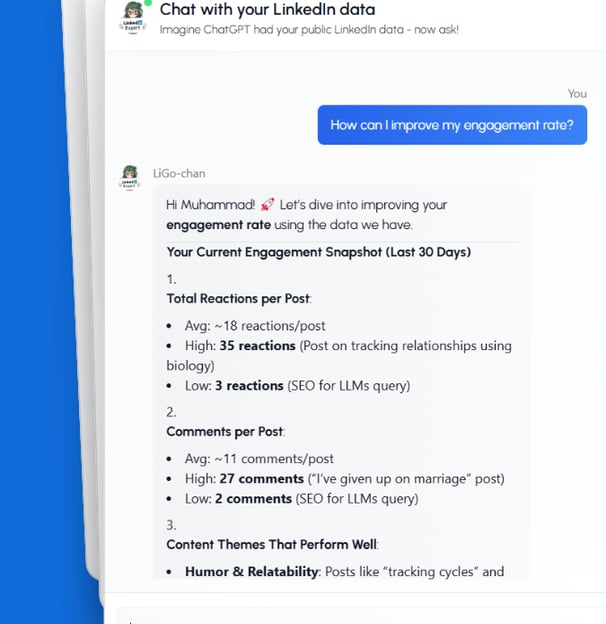
This is where LiGo truly separates itself from basic analytics tools. You can literally have a conversation with your LinkedIn data:
"Which topics drove the most client inquiries last quarter?"
"What's the difference between my high-performing posts and low-performing ones?"
"Draft me a post based on my best-performing content about client onboarding"
One agency owner asked, "What's the common theme in my top 5 posts this year?" The answer revealed that posts sharing specific client results (with numbers) outperformed everything else by 3x—a pattern he hadn't noticed despite posting daily.
Decisions LiGo Analytics Enables
Here's what agency owners tell me they do differently after using LiGo's analytics:
Time allocation: Focus LinkedIn efforts on the highest-impact days and times
Content mix: Adjust the balance of text, image, and video content based on actual performance
Topics: Double down on themes that resonate, cut those that don't
Post style: Optimize length and format based on audience preferences
Scheduling: Build a content calendar around optimal posting windows
A marketing agency owner told me: "I was spending 8 hours a week on LinkedIn and getting mediocre results. After seeing my LiGo analytics, I cut that to 3 hours, focused on Tuesdays and Thursdays between 8-10am, shifted to more text-based posts with occasional carousels, and my engagement doubled while my time investment dropped by 60%."
What This Means For Your Agency
LinkedIn isn't just another marketing channel—it's potentially your highest-ROI business development tool. But only if you're making decisions based on what actually works for your specific audience.
LiGo Analytics gives you the clarity to:
Stop wasting time on content types that don't perform
Focus your limited time on what actually moves the needle
Understand the real patterns behind your successful content
Build a LinkedIn strategy based on evidence, not assumptions
All of this translates to what agency owners actually want: more efficient lead generation, stronger positioning, and better use of your limited time.
How to Get Started with LiGo Analytics
If you're ready to move beyond guesswork on LinkedIn:
Connect your LinkedIn account
Get immediate access to your analytics dashboard
Generate your first AI insights
I built LiGo because I was tired of seeing smart agency owners waste time on LinkedIn strategies that weren't working. The analytics are designed to give you clarity, not just numbers.
Have questions about how LiGo Analytics could work for your specific agency type? Reach out directly or check out our comparison with LinkedIn Premium to see what you're missing.